

Research Inquiry Workflow Optimization
Led a cross-team discovery effort to map and diagnose how research requests move across Morgan Stanley and E*TRADE. The resulting journey map became a shared alignment artifact used by product and operations stakeholders to identify workflow bottlenecks and prioritize improvements.Company: Morgan Stanley 'E*TRADE
Role: UX Designer
Timeline: 1 month
Impact
Mapped a multi-team research request workflow
Identified major operational bottlenecks
Created a shared artifact used to align stakeholders
The problem
Research requests from institutional clients move through several internal teams before being fulfilled. However, the workflow involved multiple tools and manual coordination, which made it difficult for teams to track requests and collaborate efficiently.
Key challenges included:
Discovery of Multiple platforms used
Limited visibility into request status
Inconsistent request information
Frequent back-and-forth communication
My role
As the UX designer on the project, I led the effort to analyze and visualize the research inquiry workflow.
My responsibilities included:
Conducting interviews with Morgan Stanley developers, E*Trade Service team, Program management team, Relationship managers, and Operations
Facilitating workflow discovery sessions
Creating a journey map of the end-to-end process
Synthesizing insights and identifying improvement opportunities
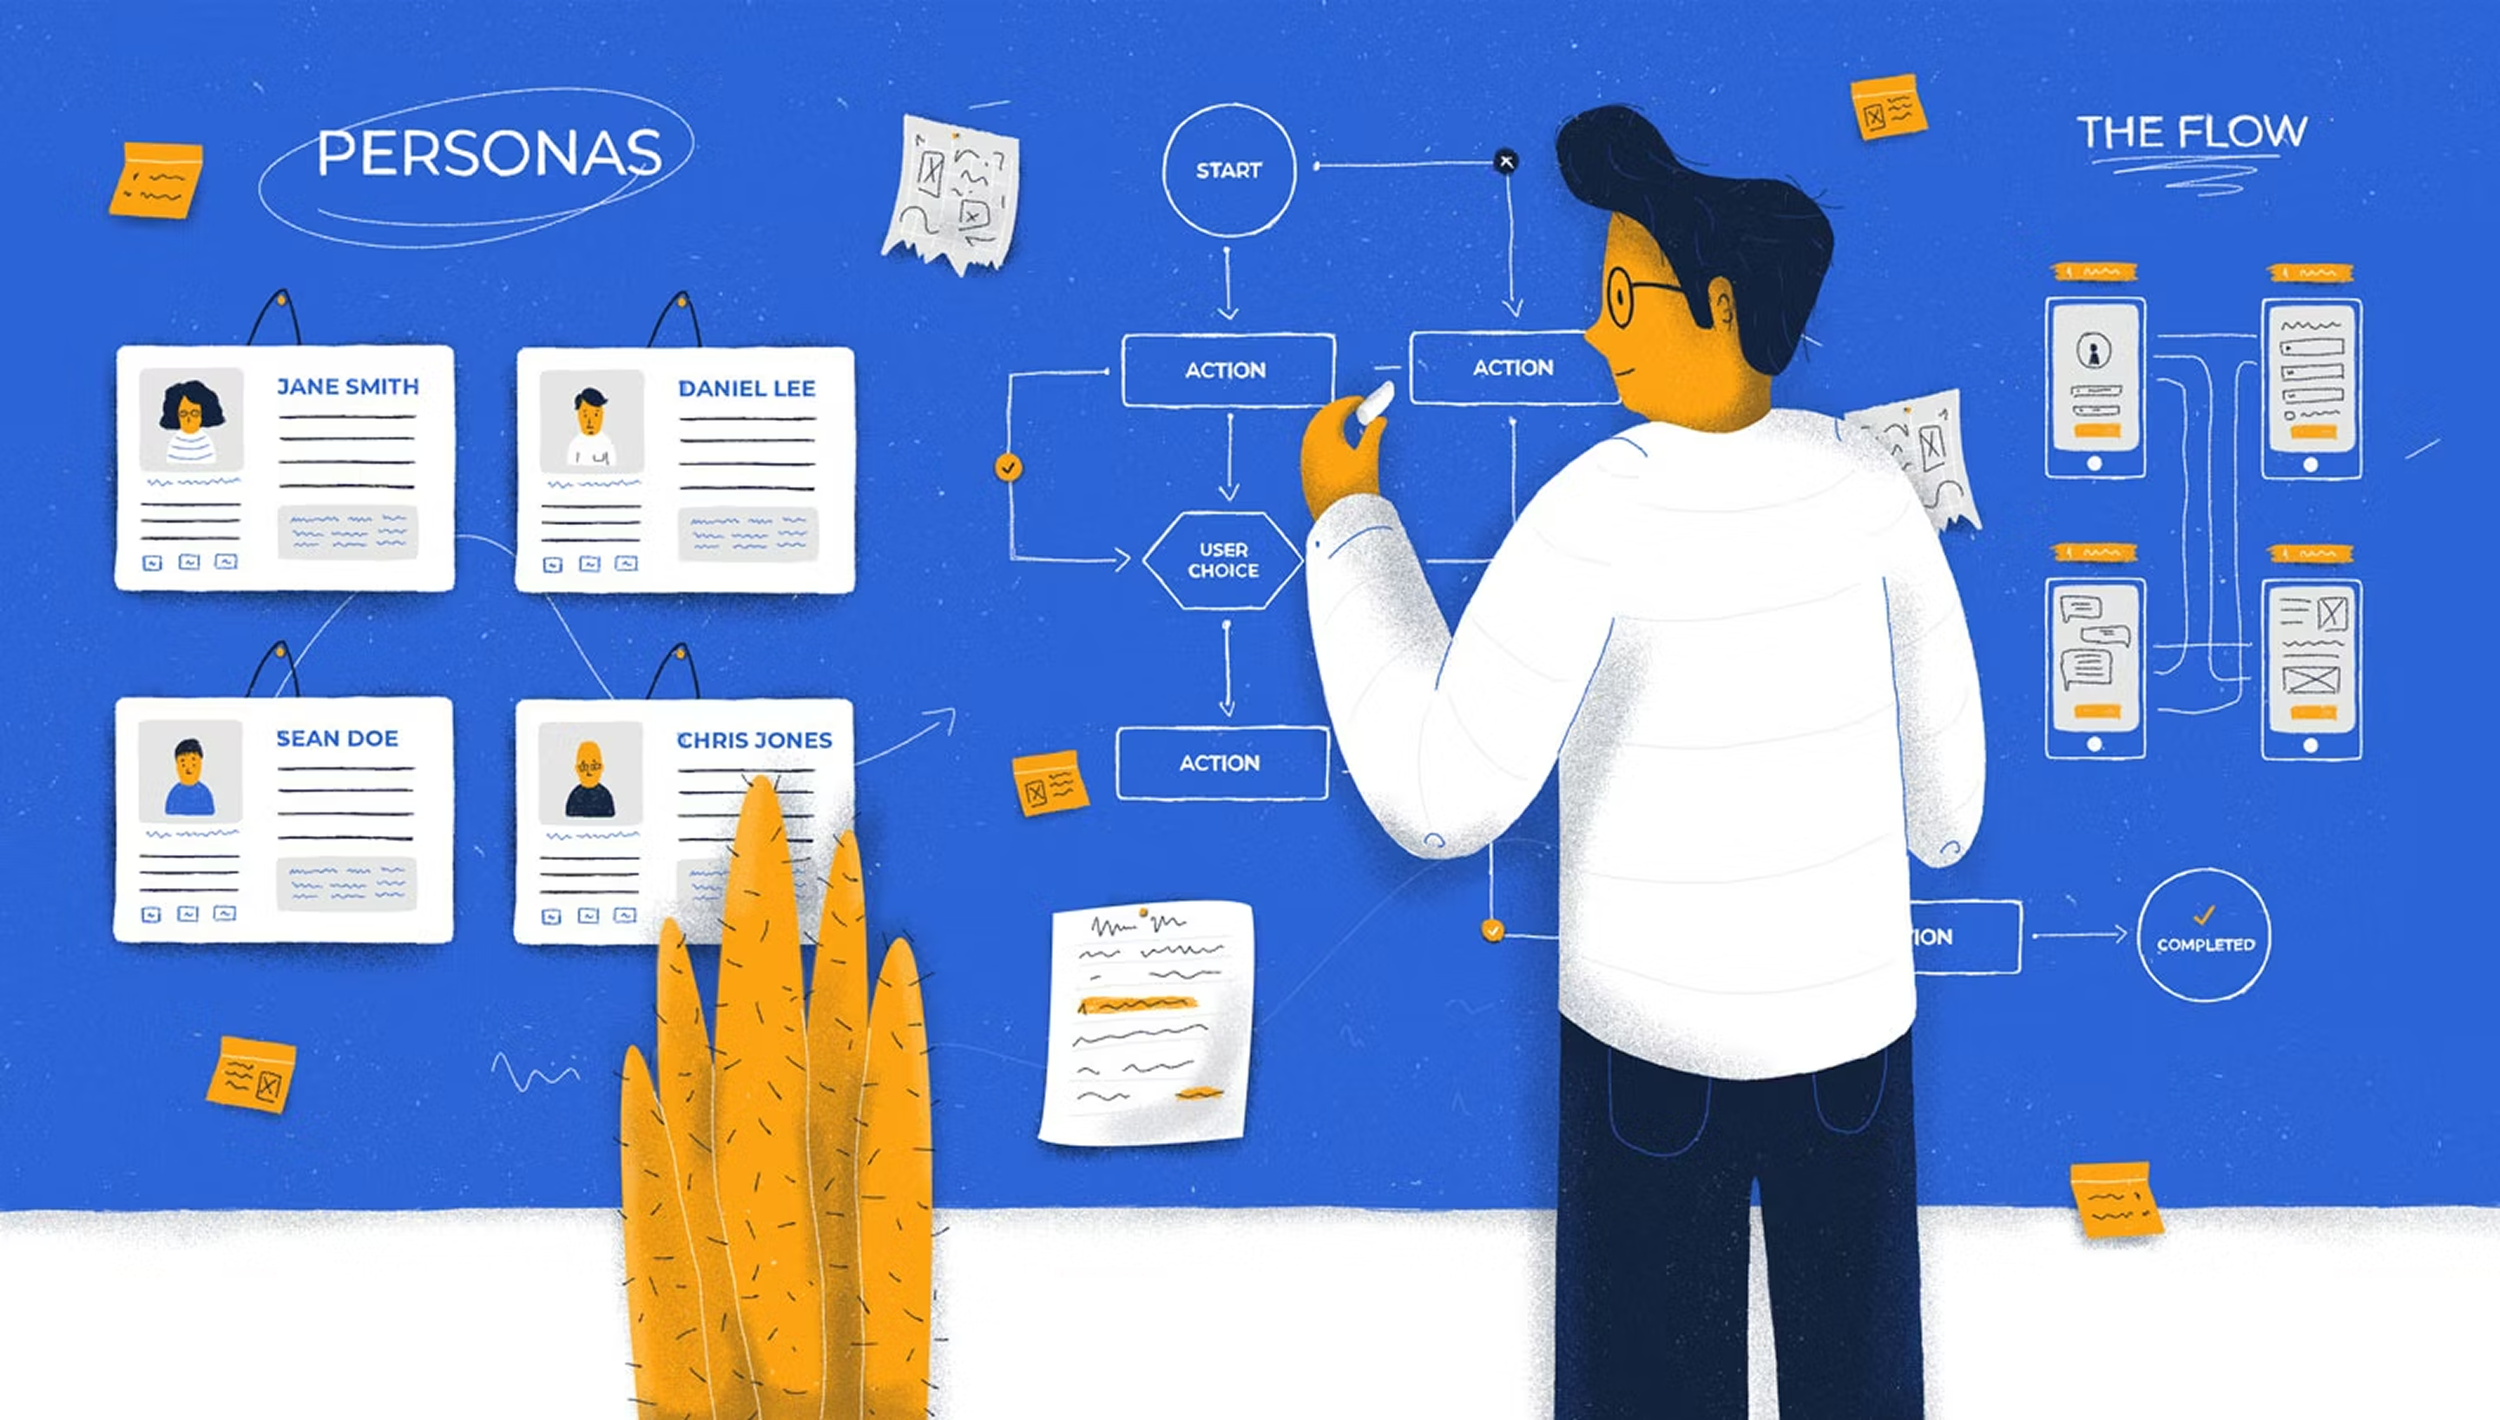
User journey map
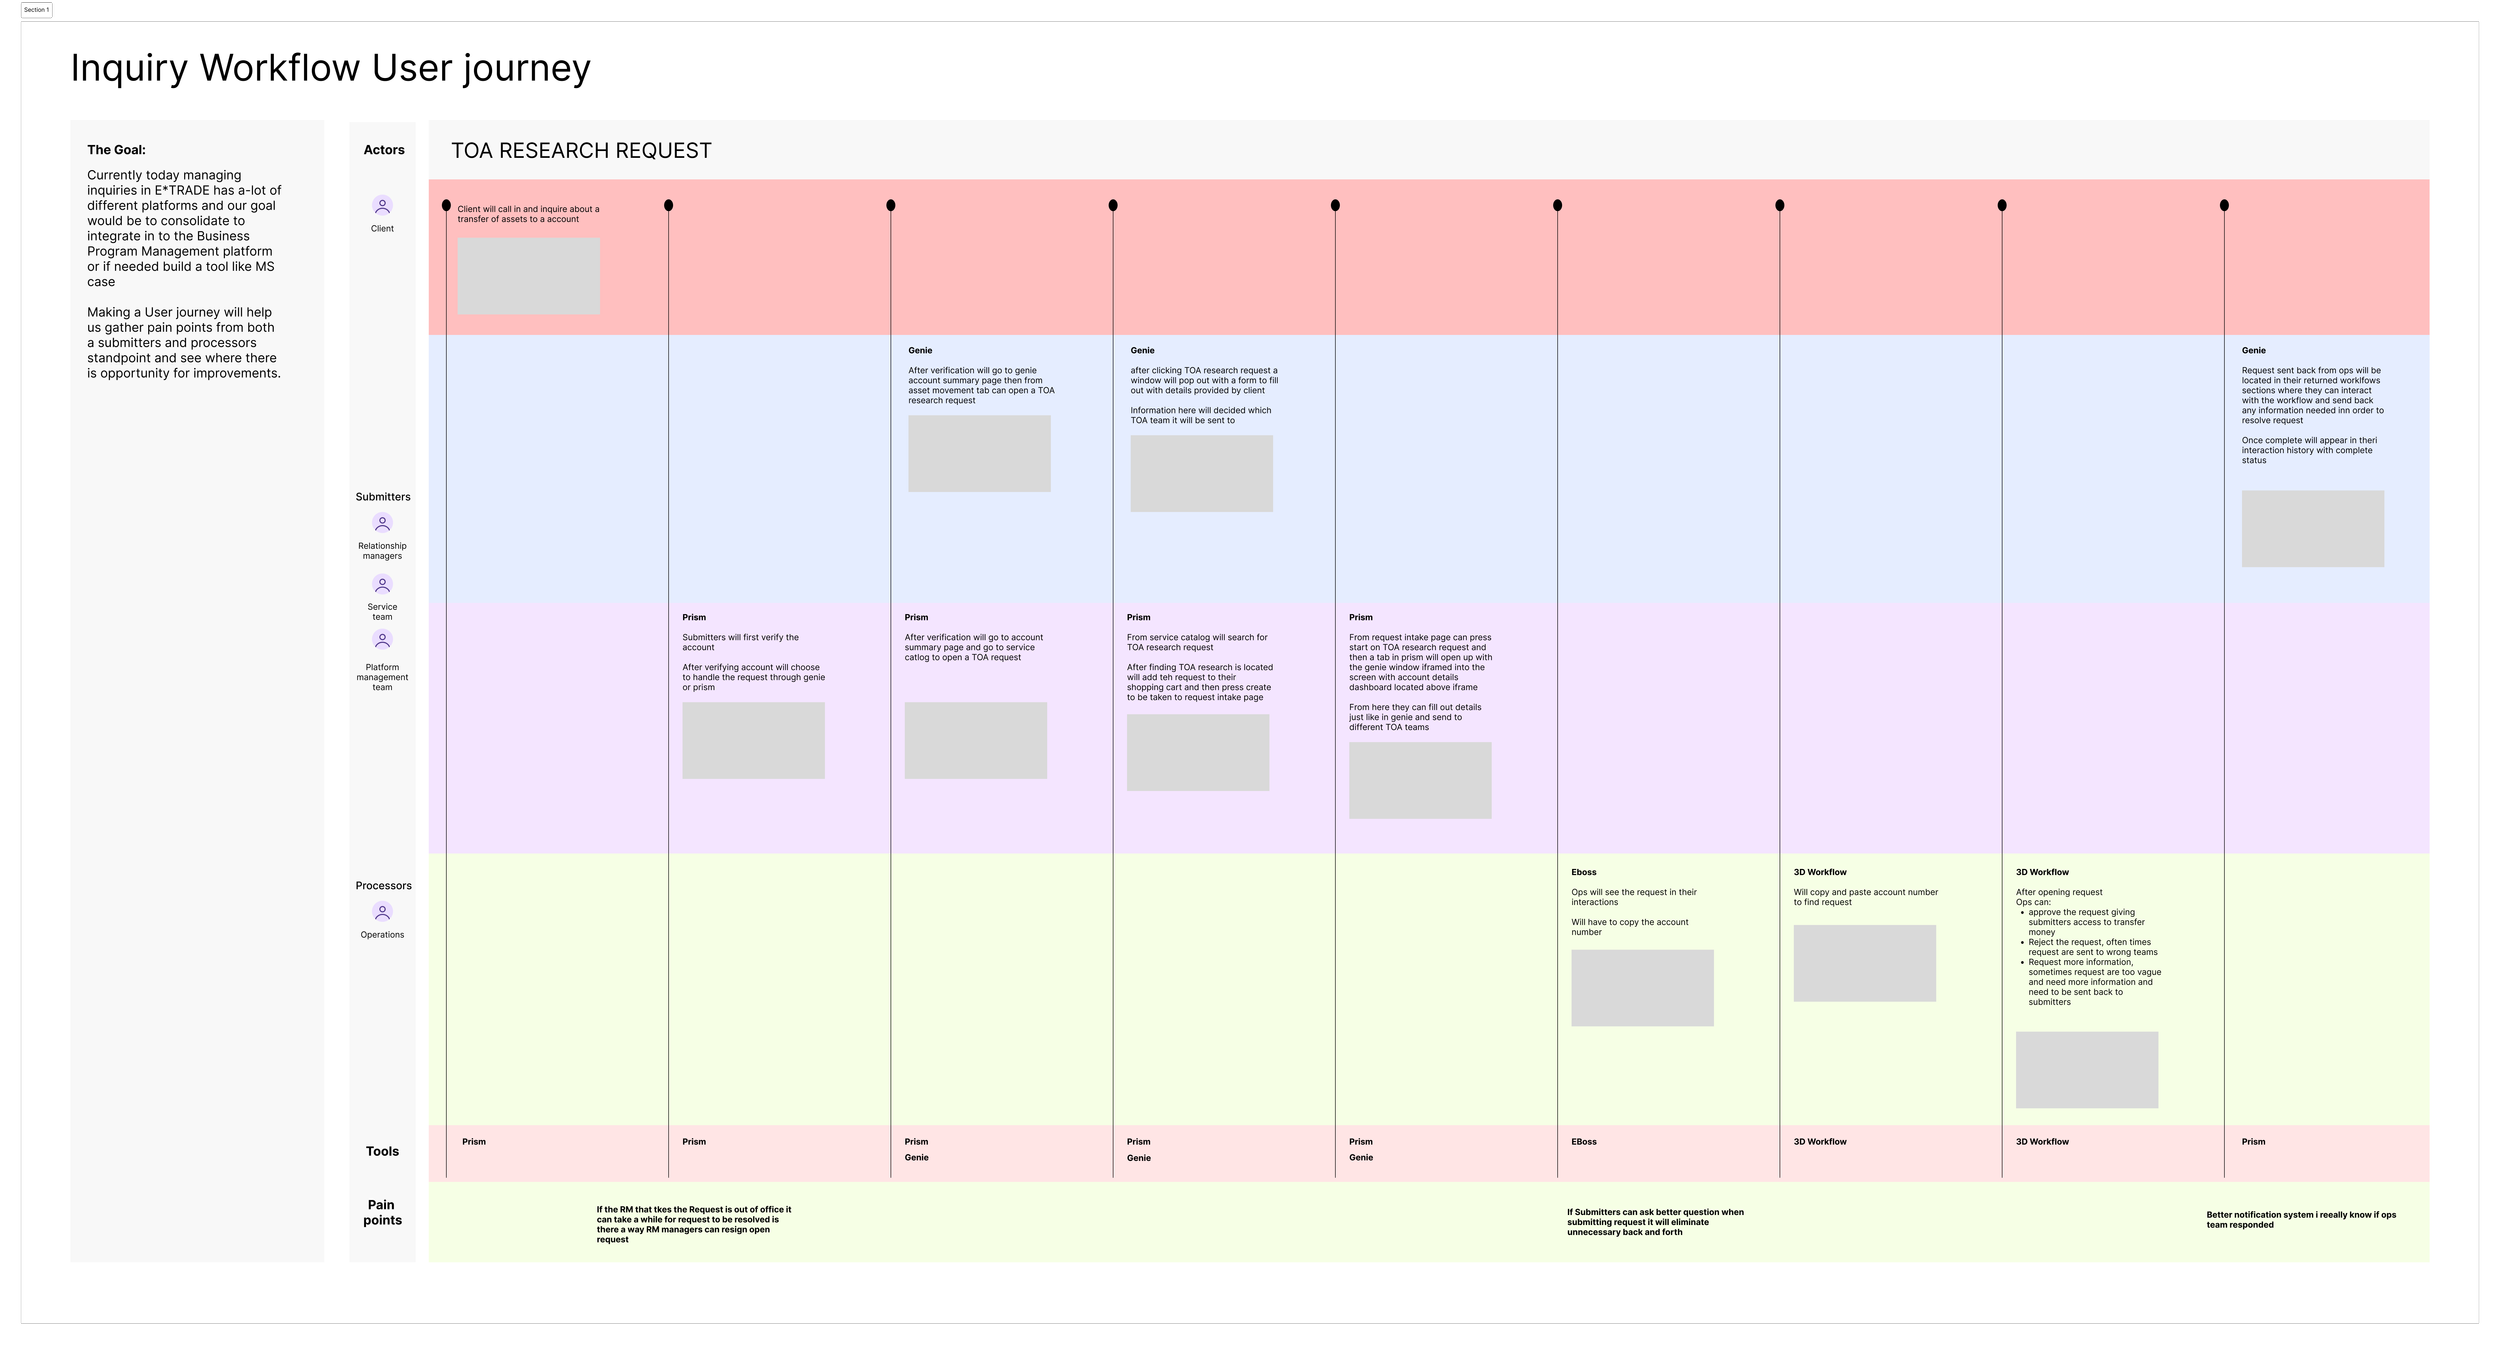
Overview:
The journey map visualizes the full lifecycle of a Transfer of Asset(TOA) Research Request, from when a client calls in to fulfillment of request.
Highlights:
The actors involved in each stage
Tools used throughout the workflow
Key decision points and handoffs
Pain points experienced by different teams
Mapping the workflow helped stakeholders understand the complexity of the process and identify areas for improvement.
Research
To understand the workflow, I worked closely with Morgan Stanley developers, E*Trade Service team, Program management team, Relationship managers, and Operations.
Methods included:
Interviews
Workflow discovery workshops
Process mapping exercises
Analysis of system touch points
These activities helped uncover how requests moved across teams and tools.
Key insights
Press on any of the arrows to learn more.-
Requests moved across multiple internal tools, requiring teams to manually track progress.
Impact
Duplicate work and additional coordination. -
Teams often lacked clarity on request status or ownership.
Impact
Frequent follow-ups and delays. -
Requests were often assigned manually to research teams.
Impact
Misrouted inquiries and slower turnaround. -
Requests sometimes lacked required details.
Impact
Back-and-forth communication between teams.
Impact
The journey map became a shared artifact used by product and operations teams to understand how inquiries are logged, addressed, and tracked.
It helped:
Align stakeholders around common pain points
Identify inefficiencies in the inquiry lifecycle
Inform future improvements to internal tools
Opportunity areas
Centralized Request Tracking
Provide a shared dashboard where both submitters and processors can track request status and ownership.
Improved Request Intake
Standardize request submission to ensure necessary information is captured upfront.
Automated Routing
Use request categorization to automatically route inquiries to the appropriate teams.
Clear Ownership
Define ownership across each stage of the workflow.
Outcome
The journey map created a shared understanding of a workflow that had never been fully documented across teams.
Direct impact:
Aligned Morgan Stanley developers, E*TRADE service teams, relationship managers, program management, and operations around a single view of the process
Surfaced four major bottleneck categories: fragmented systems, limited visibility, manual routing, and information gaps
Provided a foundation for future tooling improvements, including a centralized tracking dashboard and automated routing
This project demonstrates that UX value isn't always a new interface — sometimes it's giving an organization the clarity to see its own complexity for the first time.
Reflection
This project reinforced the importance of systems thinking when designing enterprise tools.
Many challenges were not tied to a single interface but to the coordination between multiple teams and systems.
By mapping the full workflow, we were able to uncover opportunities that would have been difficult to identify otherwise.
Confidentially note
Due to confidentially agreements with Morgan Stanley Product visuals have been removed or simplified.